1.3 Variables and the Case Format
Objective
Before you analyze your data, prepare charts or graphs, or do statistical tests, it's important to gain a sense of what that data is all about. What's the story behind the data? How good is it? Why do I care about what research questions I'm asking? The purpose of this section is to introduce you to some conceptual approaches for understanding your data before you load it into a software package like R for further analysis. You will:
Learn the difference between categorical and quantitative variables
Learn how to make categorical variables out of quantitative raw data
Find out the difference between independent and dependent variables
See how to characterize your data in terms of the 5 W's (and 1 H)
Be introduced to the concept of a case, and why it's important to prepare your raw data in case format so that a statistical software package can understand it
When I was in school, going through my first few classes on statistics and data analysis, I was really frustrated by all of these classifications of variables. I mean, why do you have to know this stuff? It just seemed like worthless memorization. What I discovered later was that the type of data you have available dictates what you can do with it.
Would you like to prepare a scatterplot and maybe perform a linear regression to generate a predictive model? Well, OK, as long as you have two quantitative variables (which are preferably both continuous). Want to do a one-way Analysis of Variance (ANOVA)? No problem, as long as you have multiple collections of quantitative variables, and you can split them up into groups using one of the categorical variables you've collected. Want to construct a bar plot? OK, but you'll need categorical data or else you should be preparing a histogram instead. Want to calculate your average grade? No problem, if your grades have been measured quantitatively, but you'll have a hard time computing your average hair color (a categorical variable). Knowing the types of variables you're working with is not only essential to prevent you from going down unproductive dead ends, but also, it will help you decide what data structures to use if you need to do more advanced programming to facilitate your data analysis.
Categorical and Quantitative Variables
A categorical variable places an observation in one (and only one) category chosen from two or more possible categories. An observation can't be in more than one category at the same time! If there is no ordering that can be done between the categories, the variable is nominal, whereas if there is some intrinsic order that can be assigned to the categories, those variables are ordinal. Here are some examples of categorical variables:
Your gender (Male, Female, or Other)
Your class in school (Freshman, Sophomore, Junior, Senior, Graduate)
Your performance status (Probation, Regular, Honors)
Your political party affiliation (Democrat, Republican, Independent)
The color of some object (red, orange, yellow, green, blue, purple)
What type of degree program someone is in (BS, BA)
Your hair color (blonde, brown, red, black, white, other)
What type of pet someone has (cat, dog, ferret, rabbit, other)
The result of someone's performance in a game (win, lose)
Race (Hispanic, Asian, African American, Caucasian)
Machine settings (Low, Medium, High)
Method of payment (Cash, Credit)
(Only two of the above examples are clearly ordinal, one is possibly ordinal if you know how the groups are assigned, and the rest are nominal. Can you pick out the ordinal variables?)
Quantitative variables, in contrast, are measured as numbers. Here are some examples of quantitative variables:
Your age
The number of siblings you have
The number of spouses you've had
The number of children you have
Your weekly, monthly, or annual salary
Your monthly rent or mortgage payment
The mass or weight of an object
The number of speeding tickets you've received
The speed you were going when you got each ticket
Your cumulative or most recent GPA (measured on a continuous scale from 0.0 to 4.0 or 5.0, depending on your school)
Just because a value is sampled as a number doesn't mean it's automatically a quantitative variable! For example, here are some numbers which are actually categorical variables in disguise:
Your social security number (yeah, can't add or subtract those... logically)
The outcome of a game where you have won (1) or lost (0)
The boarding class on your airplane ticket (1, 2, 3, or 4)
Which group you were assigned to for a team project (1,2, 3, 4, or
Your level of agreement with a particular statement (measured on a Likert scale where 1=disagree, 2=slightly disagree, 3=neutral, 4= slightly agree, and 5=agree)
Sometimes researchers will treat values measured on a Likert scale as quantitative, and create scatterplots or do inference tests that require quantitative variables. Purists, like mathematicians, think this is a terrible practice (although researchers who use this approach typically argue that the mean of values measured on a Likert scale has meaning to them). I tend to side with the mathematicians on this one.
There are Different Kinds of Quantitative Variables
Quantitative variables can be classified further as being on the interval or ratio scales of measurement. With interval data, you can perform logical operations between them, and you can add and subtract them, but you can't reasonably multiply or divide them. Temperature measurements are on the interval scale, because although you can tell which of two temperatures is higher or lower, and you can say that 80 degrees is 10 degrees warmer than 70 degrees, you can't say that 80 degrees is exactly twice as warm as 40 degrees. Length and time are quantitative variables on the ratio scale of measurement: a distance of two miles is exactly twice as long as a distance of one mile. Fortunately, these distinctions are not so important if you're just trying to figure out what statistical tests you can use, given that you know you have quantitative data.
Discrete and Continuous Data
Values that variables take on can also be classified as discrete or continuous. For example, when you roll a six-sided die, it can only take on one of six values (1 through 6). Categorical data is, by its nature, discrete. Continuous variables can take on values anywhere within an interval of possibilities. Distributions can also be discrete or continuous. It's easy to tell whether a distribution is discrete or continuous by checking to see whether it's smooth or spiky. Note that in the discrete distribution below, variables can only take on values that are numbers between 0 and 10. In the continuous distribution, variables can take on values anywhere within the interval from 0 to 10.
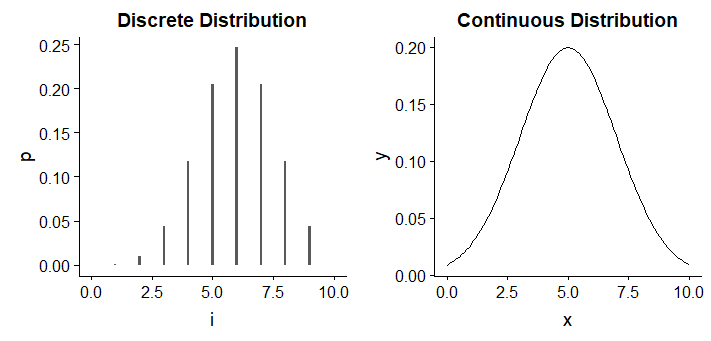
Here is the R code that produced the distributions you see above:
Independent and Dependent Variables
Independent vs. dependent describes how you plan to use your categorical and quantitative variables; it does not tell you anything about the variables themselves.
A dependent variable is one that you've decided to predict from other (independent) variables. As a result, independent variables are sometimes called predictors, and dependent variables are sometimes called response variables. If you have only one predictor and one response variable (that is, one independent variable that you use to predict one dependent variable), and both are quantitative, the dependent variable will be the one plotted on the vertical (y) axis. Because this label describes how you're using your data, you can generate multiple predictive models from one dataset and change what variables you're treating as independent and dependent. Here are some examples of what you can do:
Use simple linear regression to predict one quantitative dependent variable based on the values of one quantitative independent variable
Use multiple linear regression to predict one quantitative dependent variable based on the values of two or more quantitative independent variables
Use logistic regression to predict one categorical dependent variable based on the values of one or more quantitative (or categorical) independent variables
Recoding Quantitative Variables into Categorical Variables
Sometimes it is useful to generate categorical variables from the quantitative values you have collected. This process is called recoding. For example, say you want to do a study to see whether top performing students smoke fewer cigarettes than students who don't do as well. How do you determine which students are the high performers, and which students are not? Perhaps you might ask them if they're in an honors program or not, but the criteria for getting into an honors program is different from school to school. Also, there may be lots of high performing students who have chosen not to enroll in an honors program due to schedule constraints, program requirements, or other unrelated factors. One way to get around this challenge is to gather information about student performance in terms of a quantitative variable and then recode that variable to a categorical variable after the data is collected.
For example, you may decide that cumulative GPA is a reasonable measure for student assessment. You go out and ask 200 students to tell you their cumulative GPA (so far). You end up with a wide variety of values! A substantial fraction of students in your sample didn't do so well, and they are reporting cumulative GPAs between 0.5 and 1.8. However, there were also quite a few students whose GPAs were greater than 3.7 (something you didn't expect). How do you decide which students are the high performers? Since you have so many, you may decide that a cumulative GPA of 3.7 is a good threshold to set.
But what would happen if, in your sample of 200 students, you didn't have very many at all who achieved a cumulative GPA greater than 3.7? You might look through your data and say well, it might be more reasonable (for this group of students) to set the threshold at a cumulative GPA of 3.5. Or maybe you will decide to set the bar a little lower, at 3.2. It all depends on what kind of data you collect.
The nice thing about collecting quantitative data wherever you can is that you always have the flexibility to decide on the boundaries for your categories later! What would have happened if you decided, before the fact, that a "high performer" was someone who had a cumulative GPA greater than 3.8? Then, you went out and collected data, and only asked students if their GPA was greater than 3.8 (thus, you collected that data as a categorical variable). When you reviewed the data you had collected, you found out that no students reported a cumulative GPA greater than 3.8! In this case, your research study would be dead in the water. SOL, and not in the educational-standards sense. You would have to start over... and you probably wouldn't be happy about it.
You lose information when you recode quantitative variables into categorical variables. As a rule, it's always best to collect data as quantitative when you can, and reserve the privilege of creating categorical variables from your quantitative values later.
To recode a quantitative variable into a categorical value, just 1) decide on the boundaries for your categories, and 2) assign each quantitative variable into a category. You can revise your recoding as often as you need to. It's a great superpower to have.
A Simple Characterization of Metadata Using the 5 W's (and 1 H)
Metadata is data that tells you more about data. What this means, in real people terms, is that it can be useful to talk about how you collected your data and why you collected your data so that people in the future will know how (and whether) to use the beautiful data resources that you have painstakingly prepared. Think of metadata as your way to ensure your legacy in the realm of personal time travel: some data analyst in the future, who finds the data that you collected, will try to determine whether he or she can use that data for their own unique purposes. And you can help them. Some of the questions you will want to answer for them (what I call the "5W/1H questions") are:
Who: There are two parts to answering this question! First, who are your data about? The data can be about a person, a group of people, an object or class of objects (e.g. computers, machines, or a particular type of computers or machines), a type of animal, or maybe even an inanimate object like a lake or pond (where you might be collecting information about water quality or other aspects of the environment). Second, who is collecting the data? A future researcher will treat data collected by an elementary school student much differently than he or she would treat data collected by a scientist or a professional in industry. Be sure to establish your qualifications for collecting the data, and in what context you are applying your skills. You may even want to include contact information in case anyone has a question about your data.
What: What is your data about? What types of data are you collecting about whatever subject you identified when you answered the "who" question? I like to provide a subjective overview about each of my variables here, sometimes articulating which are categorical and which are quantitative, the enumerations of each of the possible categories, and whether I recoded some quantitative data to get some of the categorical variables.
When: When were your data collected? This is particularly important if you wish to look at changes in the values of a variable that occur over time (for example, measurements of CO2 in the atmosphere if you are studying global warming). Also, values collected earlier in time will be subject to the limitations of the less advanced sensors or technologies that are used to collect the measurements.
Where: In what location(s) did you collect your data? Sometimes, this can be as easy as collecting a geographical marker (for example, a latitude and longitude) for each item in your sample. Or, you might just describe the location that is associated with all of your data, for example, the city, country, or organization within which your data was acquired.
Why: For what original purpose did you collect your data? What were the objectives of your study? This will help a future researcher understand the assumptions and limitations that you were aware of at the time the data were collected.
How: How were the data collected? You might want to explore what instruments you used to measure the values for each variable, or what sampling strategies you used to ensure a random sample where the observations are independent. If you obtained your data from an archive (or from multiple archives), be sure to include the locations of the archives, so that someone in the future will potentially be able to retrieve the source data directly from the same location you did.
Why is it important to describe these things? First and foremost, because if you don't do it at the point of data collection... you'll probably forget. If you're young, or if this data is important to you, you might be thinking "no way... I'm not going to forget." But you will. I've collected so much data over the past two decades that when I go back and look at an old dataset, I have to remind myself what I was thinking about the first time I worked with it. So, metadata provides a way for my past self to communicate with my future self and help her be more productive.
Second, while you're analyzing your data, you may need to enlist the help of friends, colleagues, or other smart people on the internet who can help you troubleshoot the issues you're having analyzing your data in a software system like R. People won't be able to help you if you can't provide them with useful information about your data, how you got it, and what you've done with it already. So be ready to exchange metadata and a step-by-step history of what you've done with (and to) your data with any person (or bot; yes, we're almost there) who may be able to provide help.
Third, reproducibility is becoming a more and more significant issue in the sciences. What this means is that if you've done an experiment once, you should be able to collect the data and analyze it again, and draw pretty much the same conclusions. However, this is much easier said than done. There's a huge volume of published research in the academic literature, but not all of it can be reproduced - even by the researchers who designed and executed the initial studies!
The Wikipedia page on reproducibility (http://en.wikipedia.org/wiki/Reproducibility) includes a section on "noteworthy irreproducible results" which, though sparse, includes the famous "cold fusion" case from the late 1980's. Although this would have represented a huge breakthrough in our ability to produce energy, the experiment was not reproducible and could not be verified. Also, because the results could not be reliably reproduced, further studies to explore the technological potential of cold fusion were impossible.
Finally, when you encounter data that's new to you that someone else has collected, it is always useful to ask yourself the 5W/1H questions to get a better sense of what that data is all about. Also, thinking about the data will help you understand how to structure the data for analysis in R or another statistical software system using cases (described below).
Case Format (also called “tidy data”)
I've found that the most challenging aspect of gathering data is making sure you format your results so a statistical software package will actually be able to do something with it. Here are some heuristics (rules of thumb) to help you format your data. In your mind, picture a spreadsheet with rows, columns, and cells where you will enter each element of your data
Each of the columns should contain ONE AND ONLY ONE variable
Each of the rows should contain ONE AND ONLY ONE "who" from your sample
The total number of rows should equal n, the number of items in your sample
Each cell should contain ONE AND ONLY ONE value
For example, if you are collecting information about the distributions of colors and defects in a bag of M&Ms, it's very easy to produce a spreadsheet that looks like this:
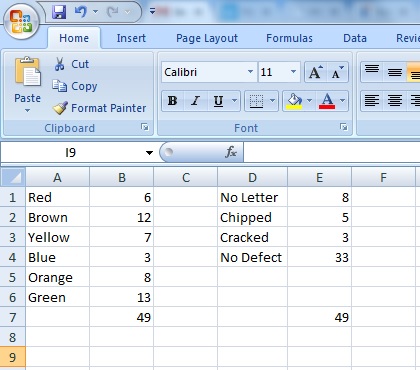
However, this is bad! If you try to upload data in this format into a statistical software package, it won't know what to do. It's not in case format. After you answer the 5W/1H questions, you'll know that that answer to "Who are your data about?" is "the M&Ms." Each case (or row) in your properly formatted data should be about one (and only one) "who" - which, in this case, is one M&M.
Each row should contain data about one (and only one) of the M&Ms in your sample. In contrast, here's what properly formatted data, organized as cases, looks like:
Variable names in row one
One variable name per column
“Clean” one-word variable names wherever appropriate
One observation (case) per row
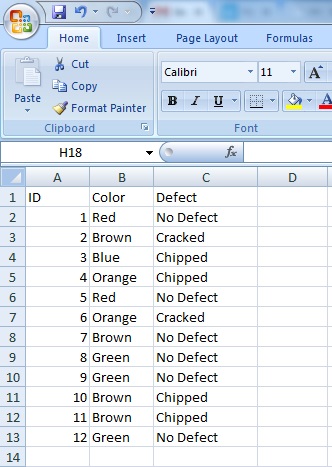
Notice how each row contains data collected from one M&M. Also, we didn't include any summary information or descriptive statistics in our spreadsheet - for example, the total number of items in our sample (49) that's been tallied in the previous example. Our statistical software can very easily produce any of this summary information, so we don't need to add it up ourselves.
We have been consistent in labeling the values from our categories so that our statistical software will be easily able to compile the values (that is, we didn't say "Red" in one place and "RED" in another - R will treat those as two completely different values).
Other Resources
Confused about recoding quantitative variables into categorical variables? Read: https://drive.google.com/open?id=1ryRmLuR7Rr_rxKRJahTs6pq0d0N7Hs22v69NJ8y4wU4
Here is a web-based game that lets you guess whether a variable is categorical or quantitative: http://mathnstats.com/applets/Categorical-Quantitative.html
Here's a useful article on continuous quantitative vs. categorical data: https://eagereyes.org/basics/data-continuous-vs-categorical
Jeff Good of UC Berkeley has written "A Gentle Introduction to Metadata" at http://www.language-archives.org/documents/gentle-intro.html
A catalog of R resources for reproducible research is available at http://cran.r-project.org/web/views/ReproducibleResearch.html
There is even a Coursera class where you can learn all about reproducible research! Find it here: https://www.coursera.org/course/repdata